
Energy landscape of HERC
Hennepin County communications frequently tout HERC’s electricity production:
HERC produces enough electricity to power 25,000 homes. (Source)
The framing of this statement, while true, is misleading.
HERC does not DIRECTLY power 25,000 homes
County statements like the one above, and similar ones that are more strongly worded (“HERC powers 25,000 homes”), suggest that if HERC were to shut down, 25,000 homes would lose power. This is not true.
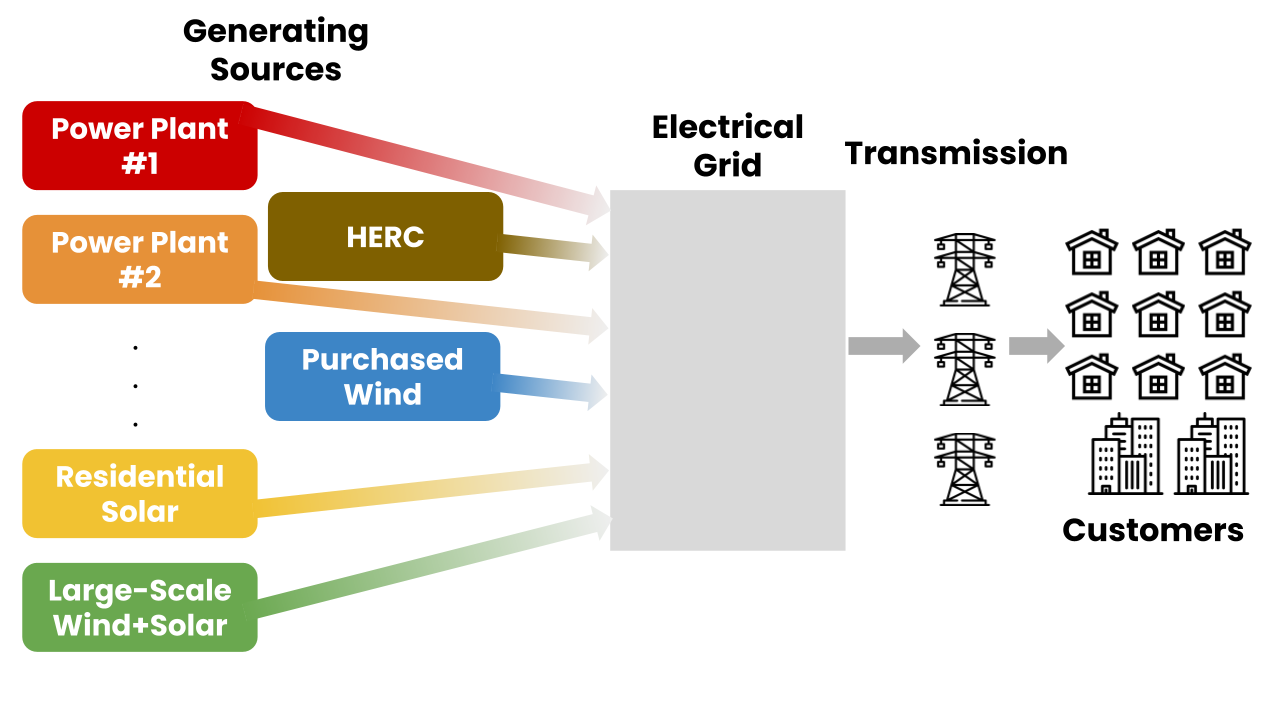
The electricity that HERC produces is sent to the electrical grid, a common merging pool for all generating sources in the state. From this common pool, electricity is transmitted to customers.
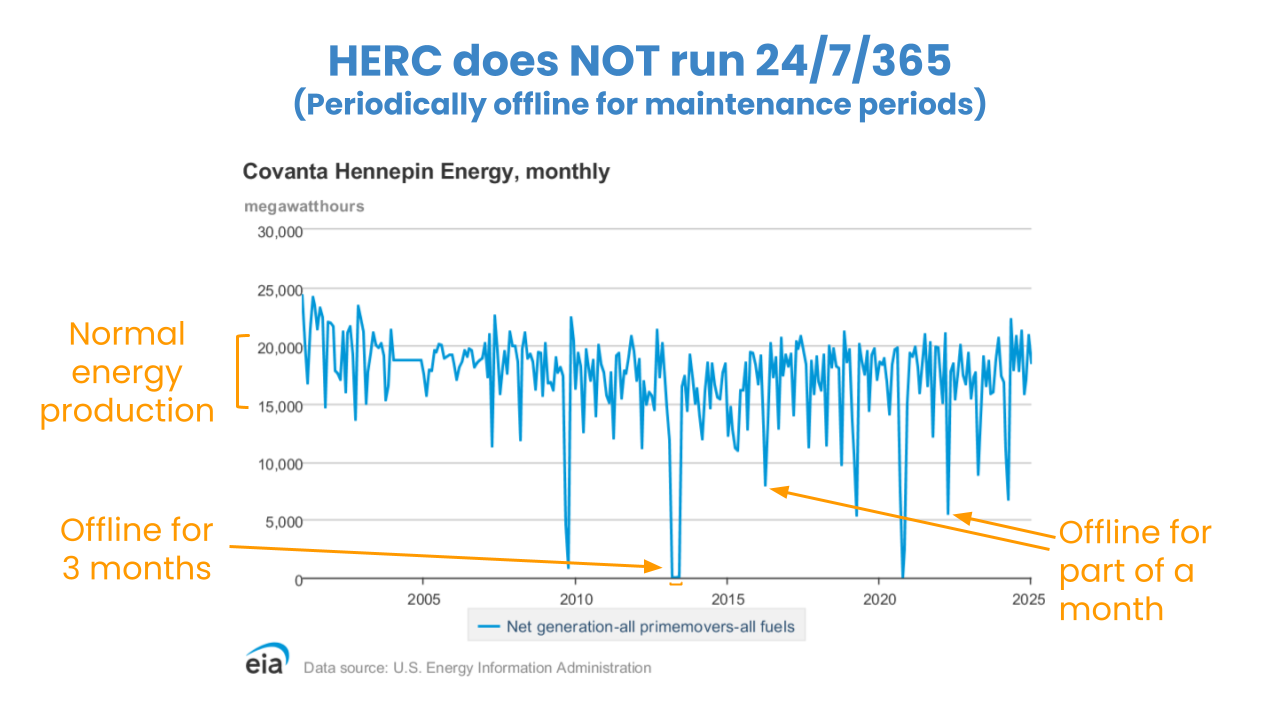
When a generating source goes offline (e.g., for maintenance), other generating sources are producing to pick up the slack. In fact, HERC is routinely offline for extended periods of time.
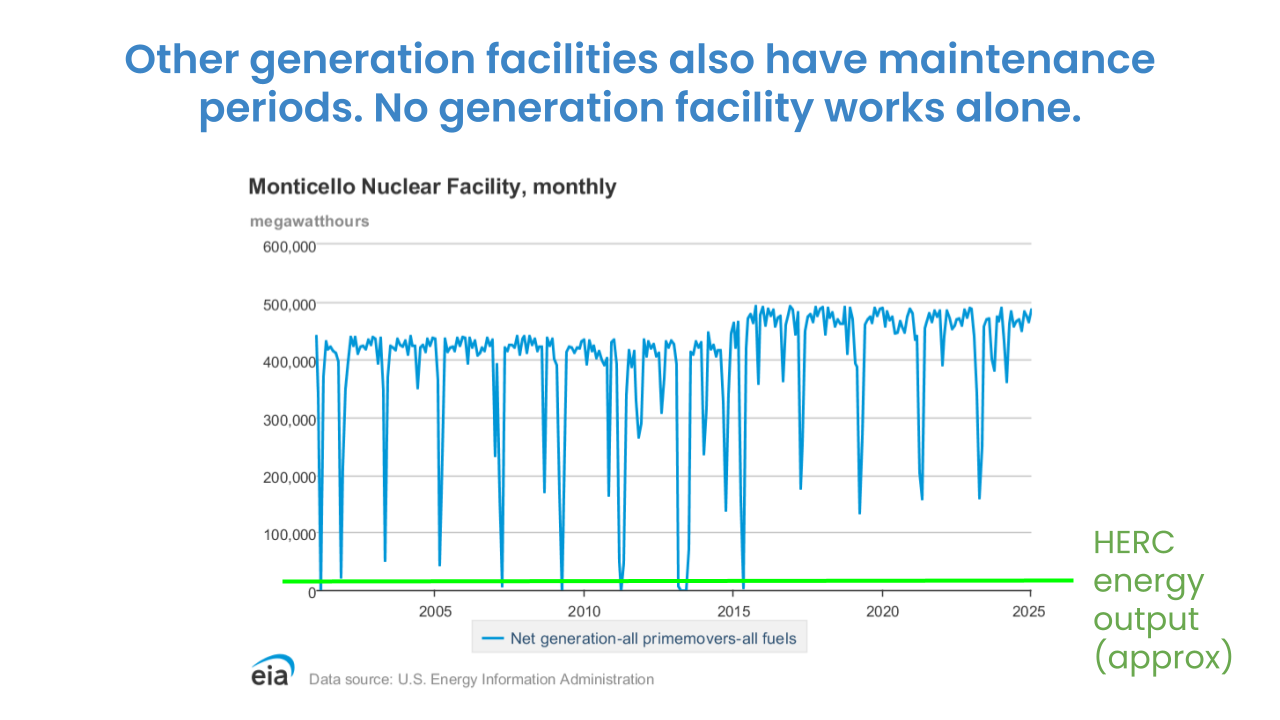
When HERC is offline, other electricity generating sources are still producing to compensate. Even the Monticello nuclear power plant, which generates about 20 times the electricity as HERC, is periodically offline.
HERC is a small source of energy production in MN
The US Energy Atlas provides a map to explore electricity generating sources across the country.
By capacity
The map below shows the capacity of electricity generation sources in Minneapolis. HERC represents about 7.3% of Minneapolis’s total capacity (40 MW out of 547.7 MW).
*Note that capacity is different from generation. Capacity indicates the amount of power a facility is theoretically able to produce. Capacity is measured in megawatts (MW). Electricity generation is measured in megawatt-hours (MWh) and represents electricity produced over a time span.
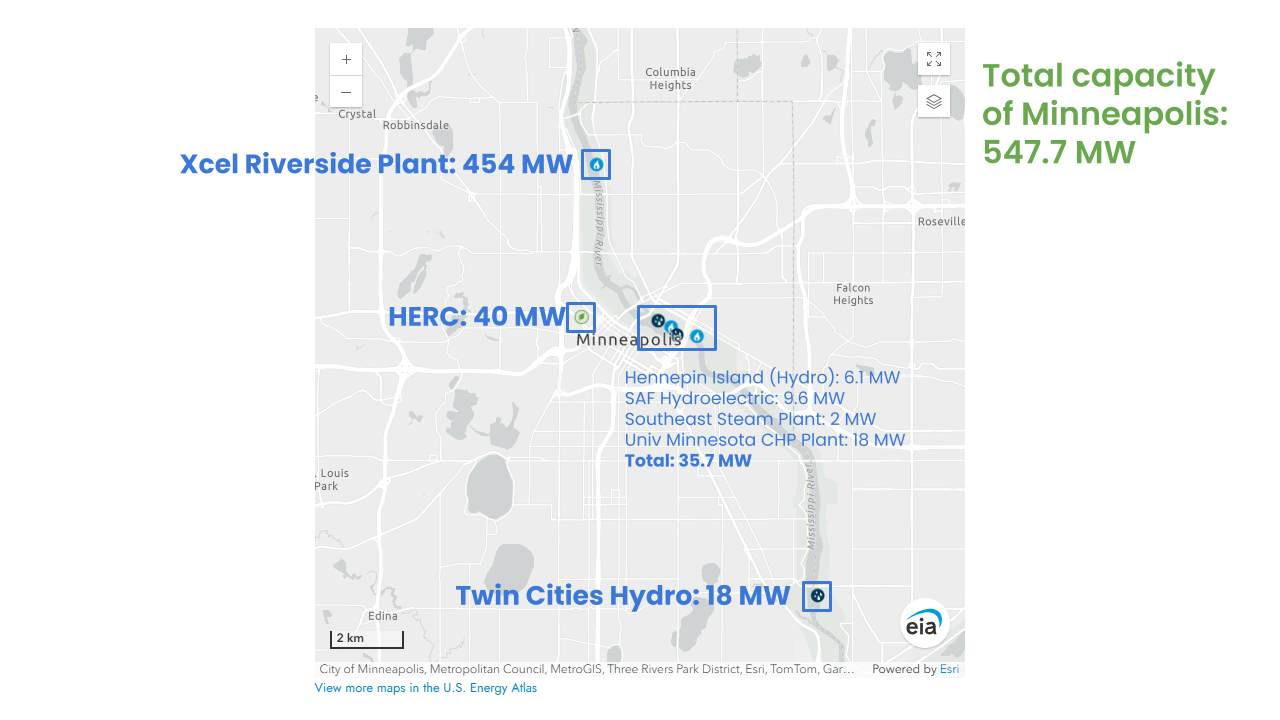
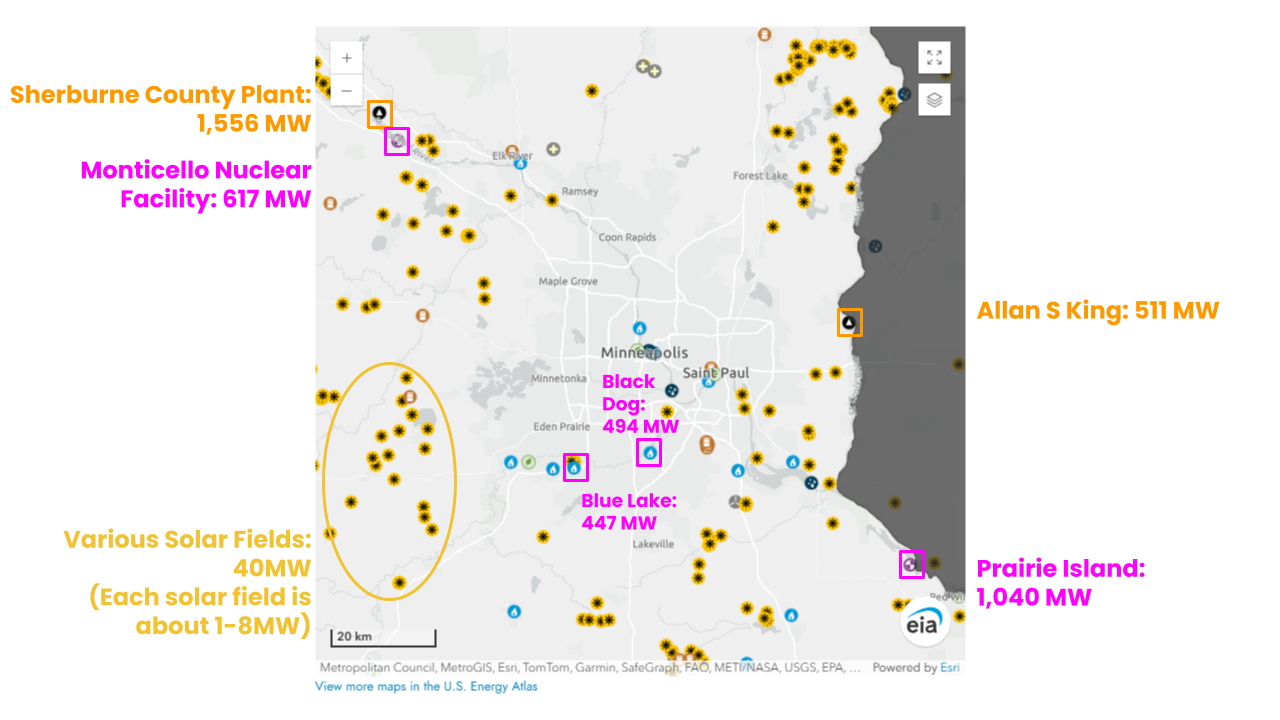
The map below show capacity of sources in the greater Minneapolis area. There are a few large producers like the Sherburne County and Prairie Island plants. We also see a large collection of solar fields spread across the area. A small collection of solar fields (shown on the left of the map) matches the 40 MW energy capacity of HERC.
HERC’s 40 MW capacity could be matched by about 12 utility scale onshore wind turbines. Total wind installation costs range from $1.2-1.8 million per MW, or about $48-72 million to build the equivalent capacity for HERC. For reference, HERC’s outstanding debt at the end of 2022 was $37.7 million, a substantial portion of the costs to install equivalent wind technology.[Source (page 32)]
By generated electricity
In total, Minnesota generates about 57 million megawatt-hours (MWh) of electricity per year (source). HERC generates about 200,000 MWh per year (source). HERC electricity generation represents a very small amount (0.35%) of Minnesota’s production.
Incineration is an inefficient means of energy production
Waste incineration has a lower energy efficiency than other means of electricity production: the amount of energy needed to create a given amount of electricity is higher for waste incinerators than other types of power plants.
Neuwahl et al. (2019) provide data on the efficiency of 41 waste incinerators in Europe (Figure 3.87 on page 278). The average efficiency across all 41 incinerators was 18.3%. The average efficiency of the 17 incinerators that burned municipal solid waste to create both heat and electricity (and thus most like HERC) was 17.2% (ranging from 9.1% to 22.5%).
The figure below compares the efficiency of incinerators and other types of generators. (Data come from this EIA page.) The efficiency of incinerators is clearly lower than that of other power plant types.
The EIA page provides information on average heat rates. A heat rate is the amount of heat (energy) required to produce one kilowatt-hour (KWh) of electricity. Heat is measured in units of British thermal units (Btu). Efficiency is calculated as 3412 Btu / heat rate because 3412 Btu is equivalent to 1 KWh of electricity.
What about the efficiency of renewable energy alternatives? As this article discusses, renewable sources like wind and solar don’t use heat to produce electricity like natural gas, nuclear, coal, and petroleum plants do. Instead, efficiency is calculated based on the theoretical amount that sunlight and wind energy can produce. Estimates of wind power plant efficiency range from about 35% to 47%. Solar power plant efficiency is estimated to be about 22%, with continual increases in efficiency expected as technology improves.
References
Neuwahl, Frederik, Gianluca Cusano, Jorge Gómez Benavides, Simon Holbrook, and Serge Roudier. 2019. “Best Available Techniques (BAT) Reference Document for Waste Incineration.” Industrial Emissions Directive. https://eippcb.jrc.ec.europa.eu/sites/default/files/2020-01/JRC118637_WI_Bref_2019_published_0.pdf.